As part of an exploratory dialogue someone from our old world (longevity) asked if we might use some data intelligence to tease out a relationship. The relationship in question was individual wealth versus size of life insurance policy.
The relationship mattered because an investor holding longevity risk will see her returns suffer (substantially) as the pace of mortality slows across cohorts in her portfolio.
Not inconsequential: these portfolios can be worth hundreds of millions of dollars.
Wealth Effects
In life insurance there is a well-established link between wealth and mortality; the rich live longer.
In this instance the argument came from the other direction: was there a chance we were seeing artificial farming of policies? That is, was there excessive issuance of policies against given risk classes / cohorts?
Were certain brokers and insureds manufacturing (a bad word in the insurance world - don't ask) policies?
Two worlds collide: the public and private
In data science pairing distinct data sets can be a very powerful analysis tool. Here, we had access to a private data-set mapping individuals to policies. We had little information regarding those individuals, but we did have some - DOB, Sex, Zip code, as well as some health data.
Not many features to be sure, but then on the other hand we did have some $30bn worth of insurance issued by dozens of Carriers to thousands of individuals - a not insignificant cohort.
We decided to pair that data up with widely available data: income and property values across zip codes in the US.
Public Data
We used this: www.city-data.com. It's a fantastic site packed with all sorts of information. Here is the page for just one zip and if you look a little more than halfway down you will see lines labelled -
Estimated median house/condo value
Estimated median household income
Let's use those.
Robotic Work?
The page above represents one zip-code. We had 1,600 to research.
Since it's early-February and you'll persuade nobody but a summer intern to click through all of those zip codes why not instead ask the machine to read in the info? With this type of data structure the task is trivial.
Here's an excerpt from our output -
So what's going on here?
For each zip code we asked how much life insurance was spread across how many lives.
We then compared that result to the median salary and property value for individuals in that zip code fully aware that these medians are only a rough proxy for actual wealth of the true insureds; but it is a proxy - and you can construct your own within-neighbourhood-similarity arguments to strengthen/weaken that presumption - where none existed previously.
We culled incomplete data cases, and ignored zips for which we had few issued life insurance policies. This still left us with nearly $8.5bn worth of life insurance paired against some $1.5bn of property (c. 5.5:1 seems reasonable).
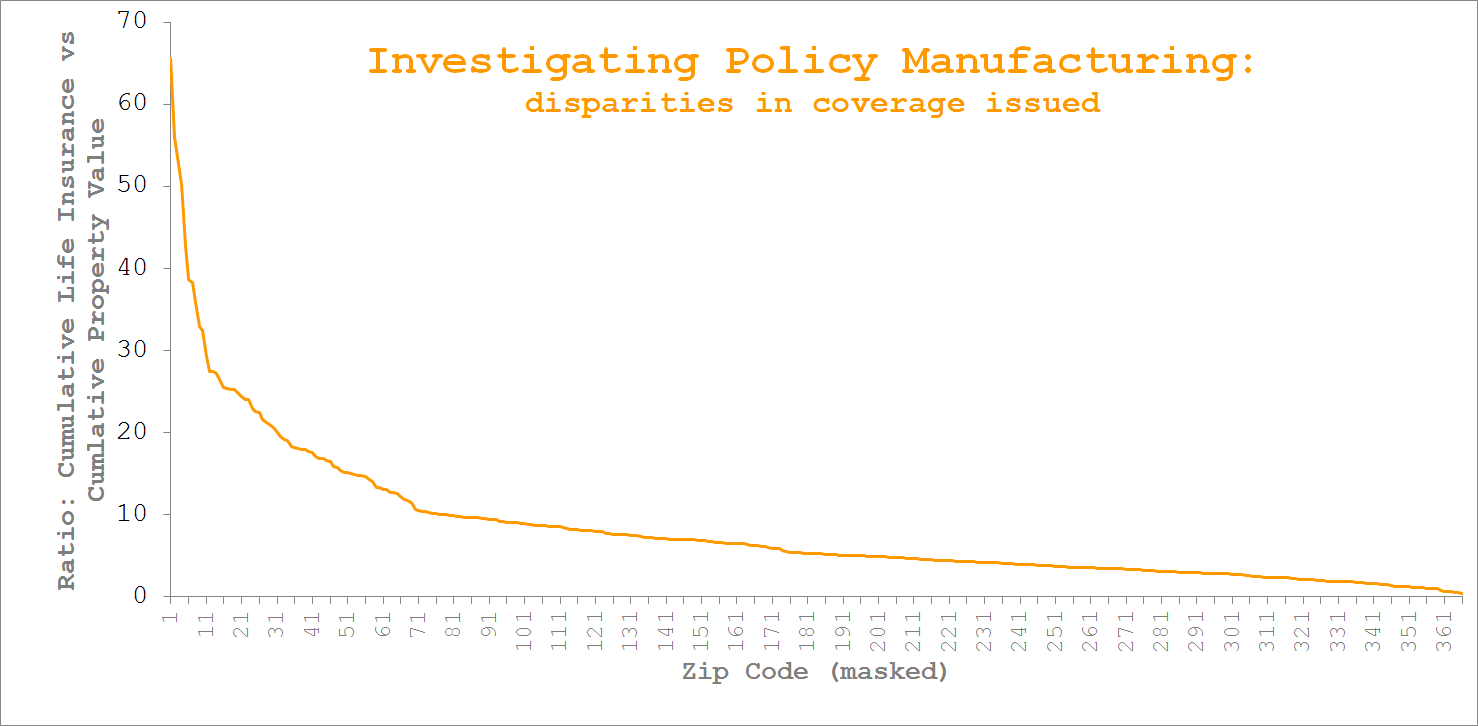
What you see is a per zip comparison of the level of cumulative life insurance held versus property value.
A good day's work?
After having received our output, tell me you - as portfolio manager - wouldn't be asking yourself why citizens in a small number of zips seemed, on the whole, to need life insurance in excess of x20 times the value of their property?